Everyone says website speed matters. But how many people actually show you proof?
In this article, we’re pulling back the curtain on our own website BitsRanker.com and walking through every metric from a real Google PageSpeed Insights audit, conducted on June 26, 2026. We scored 100 on desktop Performance and 99 on mobile, and we’re going to show you exactly what that looks like, what each number means, and what you can do to achieve the same results for your website.
No theory. No generic tips. Real data, real scores, real explanations.
What Is Google PageSpeed Insights and Why Should You Care?
Google PageSpeed Insights (PSI) is a free tool that analyzes your website and scores it from 0 to 100 across four categories: Performance, Accessibility, Best Practices, and SEO. It pulls both real-world field data from actual Chrome users and controlled lab data to give you a complete picture of how your site performs.
Here’s why it matters more than ever:
Google officially uses Core Web Vitals the key performance metrics inside PageSpeed Insights as a ranking signal. That means a slow website doesn’t just frustrate your visitors. It actively pushes you down in search results, hands your rankings to competitors, and costs you leads and sales every single day.
The score bands are:
- 0–49 → Poor (red)
- 50–89 → Needs Improvement (orange)
- 90–100 → Good (green)
Most websites score somewhere in the 50–75 range on mobile. Getting into the 90s takes real work. Getting to 100 takes expertise.
The Audit: BitsRanker.com on June 26, 2026
We ran BitsRanker.com through PageSpeed Insights on both desktop and mobile. Here’s the full picture.
Desktop Results: 100 Performance Score
Let’s start with desktop, where we achieved the highest possible score.
Core Web Vitals Desktop
| Metric | Our Score | What Google Considers Good |
|---|---|---|
| First Contentful Paint (FCP) | 0.5 s | Under 1.8 s |
| Largest Contentful Paint (LCP) | 0.5 s | Under 2.5 s |
| Total Blocking Time (TBT) | 0 ms | Under 200 ms |
| Cumulative Layout Shift (CLS) | 0 | Under 0.1 |
| Speed Index | 1.0 s | Under 3.4 s |
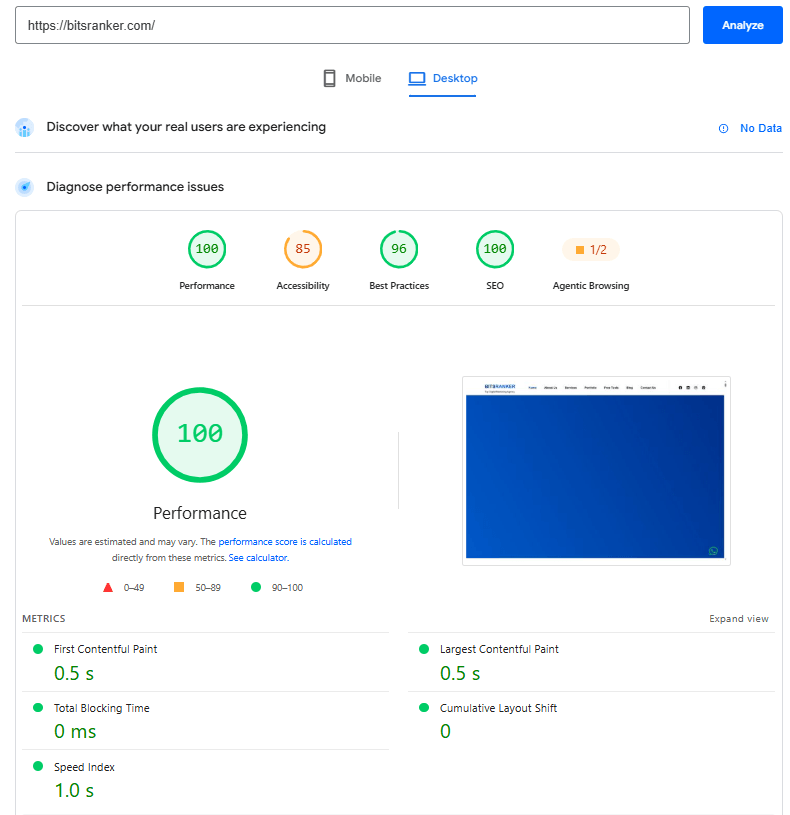
Every single metric is well inside Google’s “good” threshold and most are near-instant. Here’s what each one actually means:
First Contentful Paint (FCP) is the moment your visitor sees the first piece of content on screen any text, image, or element. At 0.5 seconds, our site is giving users something to look at almost immediately. A slow FCP makes people feel like the page is broken.
Largest Contentful Paint (LCP) measures how long it takes for the main content usually a hero image or headline to fully load. This is one of Google’s most important Core Web Vitals. Our 0.5s LCP means the page feels loaded almost as soon as it opens.
Total Blocking Time (TBT) tracks how long the main browser thread is blocked by JavaScript, preventing user interaction. Our score of 0 ms is essentially perfect it means there is no delay between the page loading and your visitor being able to click, scroll, or interact.
Cumulative Layout Shift (CLS) measures visual stability. A high CLS score means elements are jumping around as the page loads buttons move, text shifts, images pop in. Our score of 0 means the layout is completely stable from the first moment. Nothing moves unexpectedly.
Speed Index measures how quickly the visual content of the page is populated. At 1.0 second, the full visual experience of our page is available to users in under a second on desktop.
Mobile Results: 99 Performance Score
Mobile is where most websites struggle and where the biggest SEO opportunities are hiding. Google uses mobile-first indexing, meaning it primarily uses your mobile version when deciding how to rank your site.
Our mobile score came in at 99 out of 100.
Core Web Vitals Mobile
| Metric | Our Score | What Google Considers Good |
|---|---|---|
| First Contentful Paint (FCP) | 1.4 s | Under 1.8 s |
| Largest Contentful Paint (LCP) | 1.5 s | Under 2.5 s |
| Total Blocking Time (TBT) | 0 ms | Under 200 ms |
| Cumulative Layout Shift (CLS) | 0 | Under 0.1 |
| Speed Index | 1.7 s | Under 3.4 s |
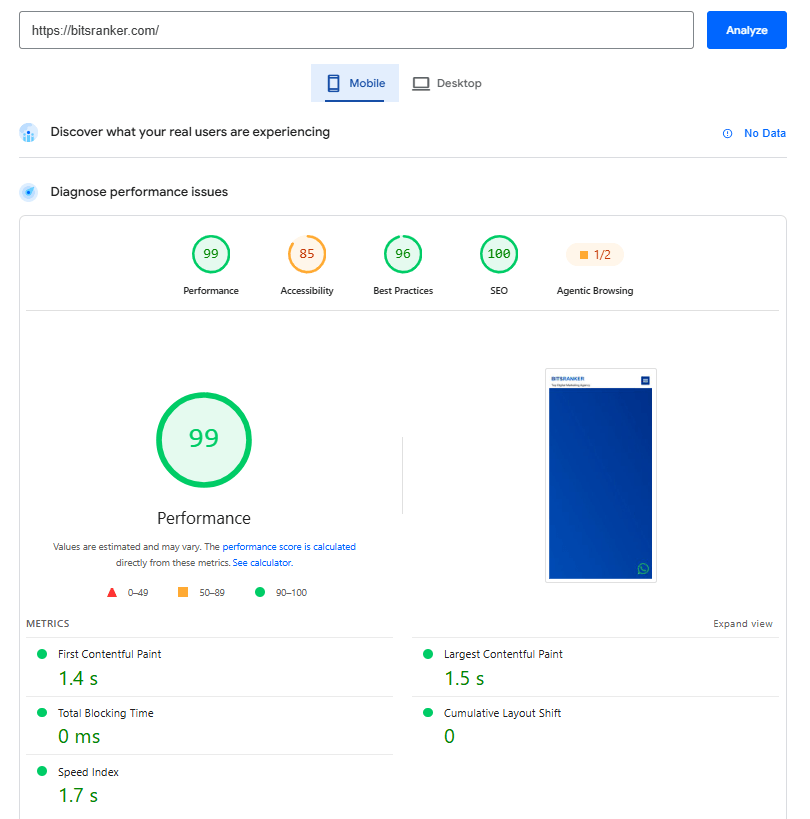
Mobile scores are naturally a little lower than desktop because the tool simulates a mid-range mobile device on a 4G connection conditions that are far more demanding than a desktop on a fast connection. Despite that, every metric is comfortably inside Google’s “good” range.
The fact that our WordPress website achieves a 99 on mobile is a direct result of building with performance as a priority from day one not as an afterthought.
Accessibility Score: 85
Both desktop and mobile returned an Accessibility score of 85. This is a good score, but we’re treating it as an active improvement target rather than something to be satisfied with.
The audit flagged the following issues:
ARIA Attributes Some elements with ARIA roles were missing required child attributes. ARIA (Accessible Rich Internet Applications) markup helps screen readers understand your page structure. Missing attributes mean some users relying on assistive technology may not get the full experience.
Color Contrast A few color combinations on the site don’t meet WCAG (Web Content Accessibility Guidelines) minimum contrast ratios. This affects readability for visitors with visual impairments.
Link Naming Some links lack descriptive accessible names, and a couple of link elements aren’t properly focusable via keyboard navigation.
Landmark Regions The page currently lacks clearly defined HTML landmark regions (like <main>, <nav>, <header>), which assistive technologies use to help users jump between sections efficiently.
Accessibility improvements are planned for our next development sprint. It’s worth noting that better accessibility also contributes to better SEO performance Google increasingly favors websites that are usable by everyone.
Best Practices Score: 96
A 96 Best Practices score means the site is built on clean, modern, secure code with only minor issues to address. The flagged items were:
- Browser console errors A small number of JavaScript errors are being logged in the browser console. These are invisible to users but indicate code that could be cleaned up.
- Deprecated API usage One external script is using a browser API that has been deprecated. This needs updating to maintain forward compatibility.
What the audit confirmed we’re doing right: strong HTTPS enforcement, proper cross-origin security policies, no detectable JavaScript vulnerabilities, trusted type practices, and no mixed content issues.
A high Best Practices score has an indirect but real impact on rankings. Google’s algorithms are increasingly able to assess code quality as a proxy for site trustworthiness. Clean code = trustworthy site.
SEO Score: 100
A perfect 100 SEO score on both desktop and mobile. This is the technical SEO layer it confirms that Google has zero obstacles when crawling, reading, and indexing our pages.
What this covers:
- Document titles are present and descriptive
- Meta descriptions are properly set
- All links are crawlable with meaningful anchor text
- No resources are blocked from Googlebot
- Structured data is valid
- Tap targets on mobile are properly sized
- The page is mobile-friendly
To be clear: a 100 technical SEO score doesn’t guarantee top rankings on its own. Rankings also depend on content quality, backlinks, domain authority, and search intent matching. But it does mean the technical foundation is rock solid no penalties, no crawl issues, no indexing problems.
Combined with our full SEO strategy, this technical foundation is what allows our content to actually compete.
Agentic Browsing: 1 out of 2
This is a newer section in PageSpeed Insights that evaluates how AI-powered browsing agents including those used by Google’s AI search features can navigate and understand your website. We scored 1 out of 2, with one flagged item:
- Accessibility title not well-formed the page title used by AI agents for navigation needs refinement.
This category is going to become increasingly important as AI-driven search experiences like Google AI Overviews expand. Websites that are structured for both human users and AI agents will have a growing advantage in future search landscapes something our digital marketing team is already factoring into our strategy.
How We Achieved These Scores: The Key Decisions
Here are the specific technical choices that produced these results. These apply whether you’re building a new site or optimizing an existing one.
1. Performance-first WordPress setup We built on WordPress but stripped out everything that wasn’t necessary. No bloated page builders loading scripts on every page. No unnecessary plugins. A lightweight theme with clean output was the starting point for everything else.
2. Image optimization at every level Every image on the site is served in WebP format, compressed without visible quality loss, and lazy loaded when it’s off-screen. Images are one of the most common causes of poor LCP scores getting this right alone can dramatically move your PageSpeed score.
3. Critical CSS inlined, everything else deferred The CSS needed to render the above-the-fold content is loaded immediately and inline. Non-critical stylesheets are deferred so they don’t block page rendering. This directly improves FCP and TBT.
4. JavaScript deferred and minimized No render-blocking JavaScript. All scripts that aren’t essential for the initial page load are deferred or loaded asynchronously. This is what produces a TBT of 0 ms.
5. Quality managed hosting with server-side caching A fast server with proper caching dramatically reduces Time to First Byte (TTFB) the time before your browser even starts receiving data. No optimization on the frontend can compensate for a slow server.
6. CDN for static assets Static files like images, CSS, and JavaScript are served via a Content Delivery Network, so users in any country get files from a nearby server rather than a distant origin server.
What This Means If You’re Looking to Improve Your Own Score
If your website is scoring in the 50s or 60s or you’ve never even checked here’s where to start:
Run your site through Google PageSpeed Insights right now and look at your Opportunities and Diagnostics sections. These are PageSpeed’s own prioritized list of what to fix. Start with whatever is flagged as having the highest estimated saving.
The most common high-impact fixes are:
- Compress and convert images to WebP often the biggest single win
- Remove unused JavaScript and CSS reduces page weight and TBT
- Fix render-blocking resources improves FCP immediately
- Upgrade your hosting if your TTFB is above 600ms, your host is the problem
- Enable caching both browser caching and server-side page caching
If you want expert help rather than doing this yourself, our WordPress development service includes full performance optimization as standard. We don’t just build websites we build fast ones.
Final Takeaway
Getting a perfect score on Google PageSpeed Insights isn’t about gaming a tool. It’s about building a website that genuinely works well for your users, for Google, and for your business.
At BitsRanker, these scores are the result of real expertise applied to our own website. We know what it takes because we’ve done it. And we bring that same approach to every client project whether it’s a WordPress build, a technical SEO engagement, or a full digital marketing strategy.
If your website is slow, underperforming, or you simply don’t know where it stands get in touch with BitsRanker and let’s fix it.
Check your own site now: Google PageSpeed Insights →